Data Science & Analytics | Booknibs
Data Science & Analytics
Explore focused learning nibs in Data Science & Analytics on Booknibs.
William Playfair and the Birth of Modern Data Charts and Statistical Graphics

Explore how a Scottish rogue and engineer named William Playfair forever changed the way we process information by inventing the first charts and graphs. You will learn the science of visual encoding, which explains why your brain understands shapes and slopes much faster than long lists of digits. This nib reveals how to spot "pre-attentive" patterns, such as the sudden drop in a line or the width of a bar, to make faster and more accurate decisions. By understanding these visual tools, you will see how to turn dry data into a persuasive story, making complex facts impossible to ignore.
Ronald Fisher, the Lady Tasting Tea, and the Birth of Modern Statistics

This nib explores how a simple dispute over a cup of tea revolutionized modern science. You will discover how an afternoon snack in 1919 led to the birth of the "null hypothesis," a bedrock of the scientific method that assumes a result is just a fluke until proven otherwise. The nib breaks down the importance of randomization and the "p-value" in plain English, showing you how these tools filter out human bias and random luck. By understanding these concepts, you will learn to spot the difference between a real breakthrough and a mere coincidence, a vital skill for navigating everything from medical news to tech trends.
How NBA Teams Use Movement Tracking and Predictive Data to Remake Defense
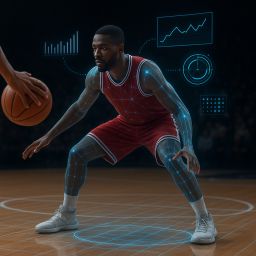
Modern basketball has evolved from a game of raw reactions into a high-speed contest of predictive physics. This book pulls back the curtain on the technology transforming the hardwood into a digital grid, where cameras and algorithms map player movement with surgical precision. Readers will learn how to decode skeletal tracking, identify biological indicators of movement, and master the concept of "pre-rotation" in defense. These insights reveal how data-driven strategies can neutralize speed and strength. Whether you are a coach or simply a fan, you will gain a deeper competitive edge by learning to spot patterns before they play out.
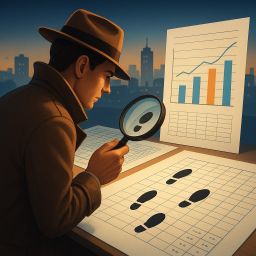
Shadow Docking: Tracking Vessels Through Data Gaps and Invisible Zones

In an era of digital transparency, shadow docking has emerged as the ultimate investigative tool for monitoring the high seas. You will learn to recognize the "data shadows" left by vessels attempting to evade tracking, master the analysis of negative space where traditional sensors fail, and apply these observational techniques to identify patterns in logistics and beyond. By understanding why silence can be the loudest signal on a map, you will gain the ability to spot invisible obstacles through the collective reactions of others. This is essential reading for anyone looking to master high-stakes intelligence and see the world beyond the obvious.
Digital Ghosts: How Agent-Based Modeling Shapes Modern Fandom

Learn how professional sports teams are revolutionizing stadium logistics using agent-based modeling. By creating a digital twin of their fanbase, the Columbus Aviators simulate thousands of individual decision-makers to predict human movement before a stadium even opens. You will discover how to identify potential bottlenecks, reduce crowd friction, and optimize pedestrian flow by testing virtual incentives. Mastering these insights helps planners transform chaotic crowds into seamless experiences. This guide explains how to move beyond static, old-school math to proactively design urban spaces, ensuring that every fan's journey, from the light rail to their seat, is efficient, profitable, and stress-free.
How Differential Privacy and Mathematical Noise are Changing the Future of Data Protection
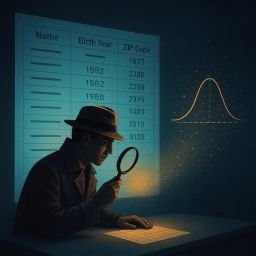
In a world where stripping names from datasets is no longer enough to keep you hidden, this guide reveals why traditional privacy is failing and how "mathematical noise" is taking its place. You will learn how the Mosaic Effect allows hackers to identify you using seemingly harmless public records, and why modern data science now relies on differential privacy to create a "cloak of invisibility." By exploring the concept of a privacy budget, you will discover how to balance the need for accurate group trends with the absolute protection of individual secrets. This isn't just theory; it is a practical look at how companies like Apple and the U.S. Census Bureau use intentional randomness to secure your personal life. Read this to understand the future of data ethics and learn why a little bit of noise is the best way to keep your private history from becoming public gossip.
Signal vs. Noise: A Guide to Moiré Patterns and Data Down-Sampling Strategies

Charts can lie to you without even trying. When too much information is squeezed onto a small screen, your brain often creates "ghost" patterns - visual glitches called moiré patterns - that make random noise look like meaningful trends. This guide teaches you the art of strategic "down-sampling," a professional technique for thinning out massive datasets without losing critical details. You will learn how to spot mathematical mirages like aliasing, where data appears to spin or pulse incorrectly. By mastering tools like the LTTB algorithm, you can ensure that important spikes and outliers remain visible even when 90% of the data is removed. Ultimately, these skills help you move past aesthetic bias, allowing you to create and interpret charts that are both visually clean and statistically honest.
Unmasking Simpson's Paradox: How Hidden Variables and Statistical Illusions Can Mislead Data Analysis
Data can be a master of disguise. In this guide, you will explore Simpson’s Paradox, a mathematical phenomenon where trends seen in small groups completely flip when those groups are combined. You will learn to identify "lurking variables," the hidden factors that trick even expert researchers into seeing bias or failure where none exists. By breaking down real-world examples from hospital survival rates to university admissions, you will gain the skills to question "average" results and spot statistical illusions. This knowledge is essential for anyone who wants to make better decisions and avoid the common traps hidden in everyday spreadsheets.
Practical SQL for Everyday Data: Demystifying Queries, Joins, and Performance

SQL still feels like a secret handshake among data pros. Picture a database as a library and SQL as your precise request: ask clearly, and the exact book appears; ask vaguely, you get a pile of irrelevant tomes. This guide spills the pattern and mindset behind SELECT, WHERE, joins, GROUP BY, window functions, subqueries and CTEs, plus practical performance thinking. It demystifies the relational model, explains how to read explain plans, and debunks myths that SQL is only for DBAs or that more joins always slow you down. With stories, exercises, and a 30-day sprint, you’ll read, write, and optimize queries with confidence.
Practical SQL Essentials: A Hands-On Guide to Queries, Joins, Aggregation, and Performance

Imagine asking a warehouse of data a single crisp question and getting an instant answer - that is SQL, the 50-year-old magic that turns messy rows into clear decisions. This course is a guided, hands-on trek from curiosity to competence: learn SELECT, filters, joins, GROUP BY, window functions, transactions, and indexes through concrete examples and a tiny bookstore schema you can tinker with. Expect analogies, humor, mini-challenges, and projects that teach performance, modeling, and real-world trade-offs. By the end you will read, write, and optimize SQL confidently - and enjoy turning rows into insight.